One of the most expensive mistakes enterprises make in the marketing arena is cutting brand strategy when margins tighten, then blaming platform volatility when CPA spikes YoY. Often what follows is further tightening of ad budgets, and an overall contraction of business growth. Sound familiar? Let’s talk about it.
When you cut brand strategy, it looks like money well saved. At first. Customers have memory, so you’ll probably coast for several months to a year or so (as research by Kantar shows).
But then, something insidious happens. People start forgetting about your brand, your product. What fills the space are other advertisers, social recommendations, alternatives they encounter in the wild.
Purchase decisions are human behavior, and many humans have both a finite memory and also a preference for novelty. Just because we used a product for a couple years or in the past and have “awareness”, doesn’t mean another brand won’t ultimately earn that next conversion.
Without investment into brand, the consumer might forget why they chose you altogether. What does this brand stand for again? Are they even doing anything new? Are they even cool anymore?
As the brand awareness halo dims, performance media starts to see the hit. Less warm interest. Fewer brand queries. Fewer people choosing your brand in a sea of options. Ad creative working with a fragmented narrative, generic messaging, and little shared context across channels gets ignored.
The algorithm notices.
Performance teams scramble to compensate with more spend, tighter targeting, faster creative turnover, promotions, etc… each of which amplifies the underlying decay.
The CFO’s Diagnostic Symptoms that Get Misread as Media Risk
So why would a company stop investing into its brand and leverage only bottom of funnel activity? It often comes from a place of logical financial analysis. However, fragmented data inputs without full context are usually what leads to flawed decisions.
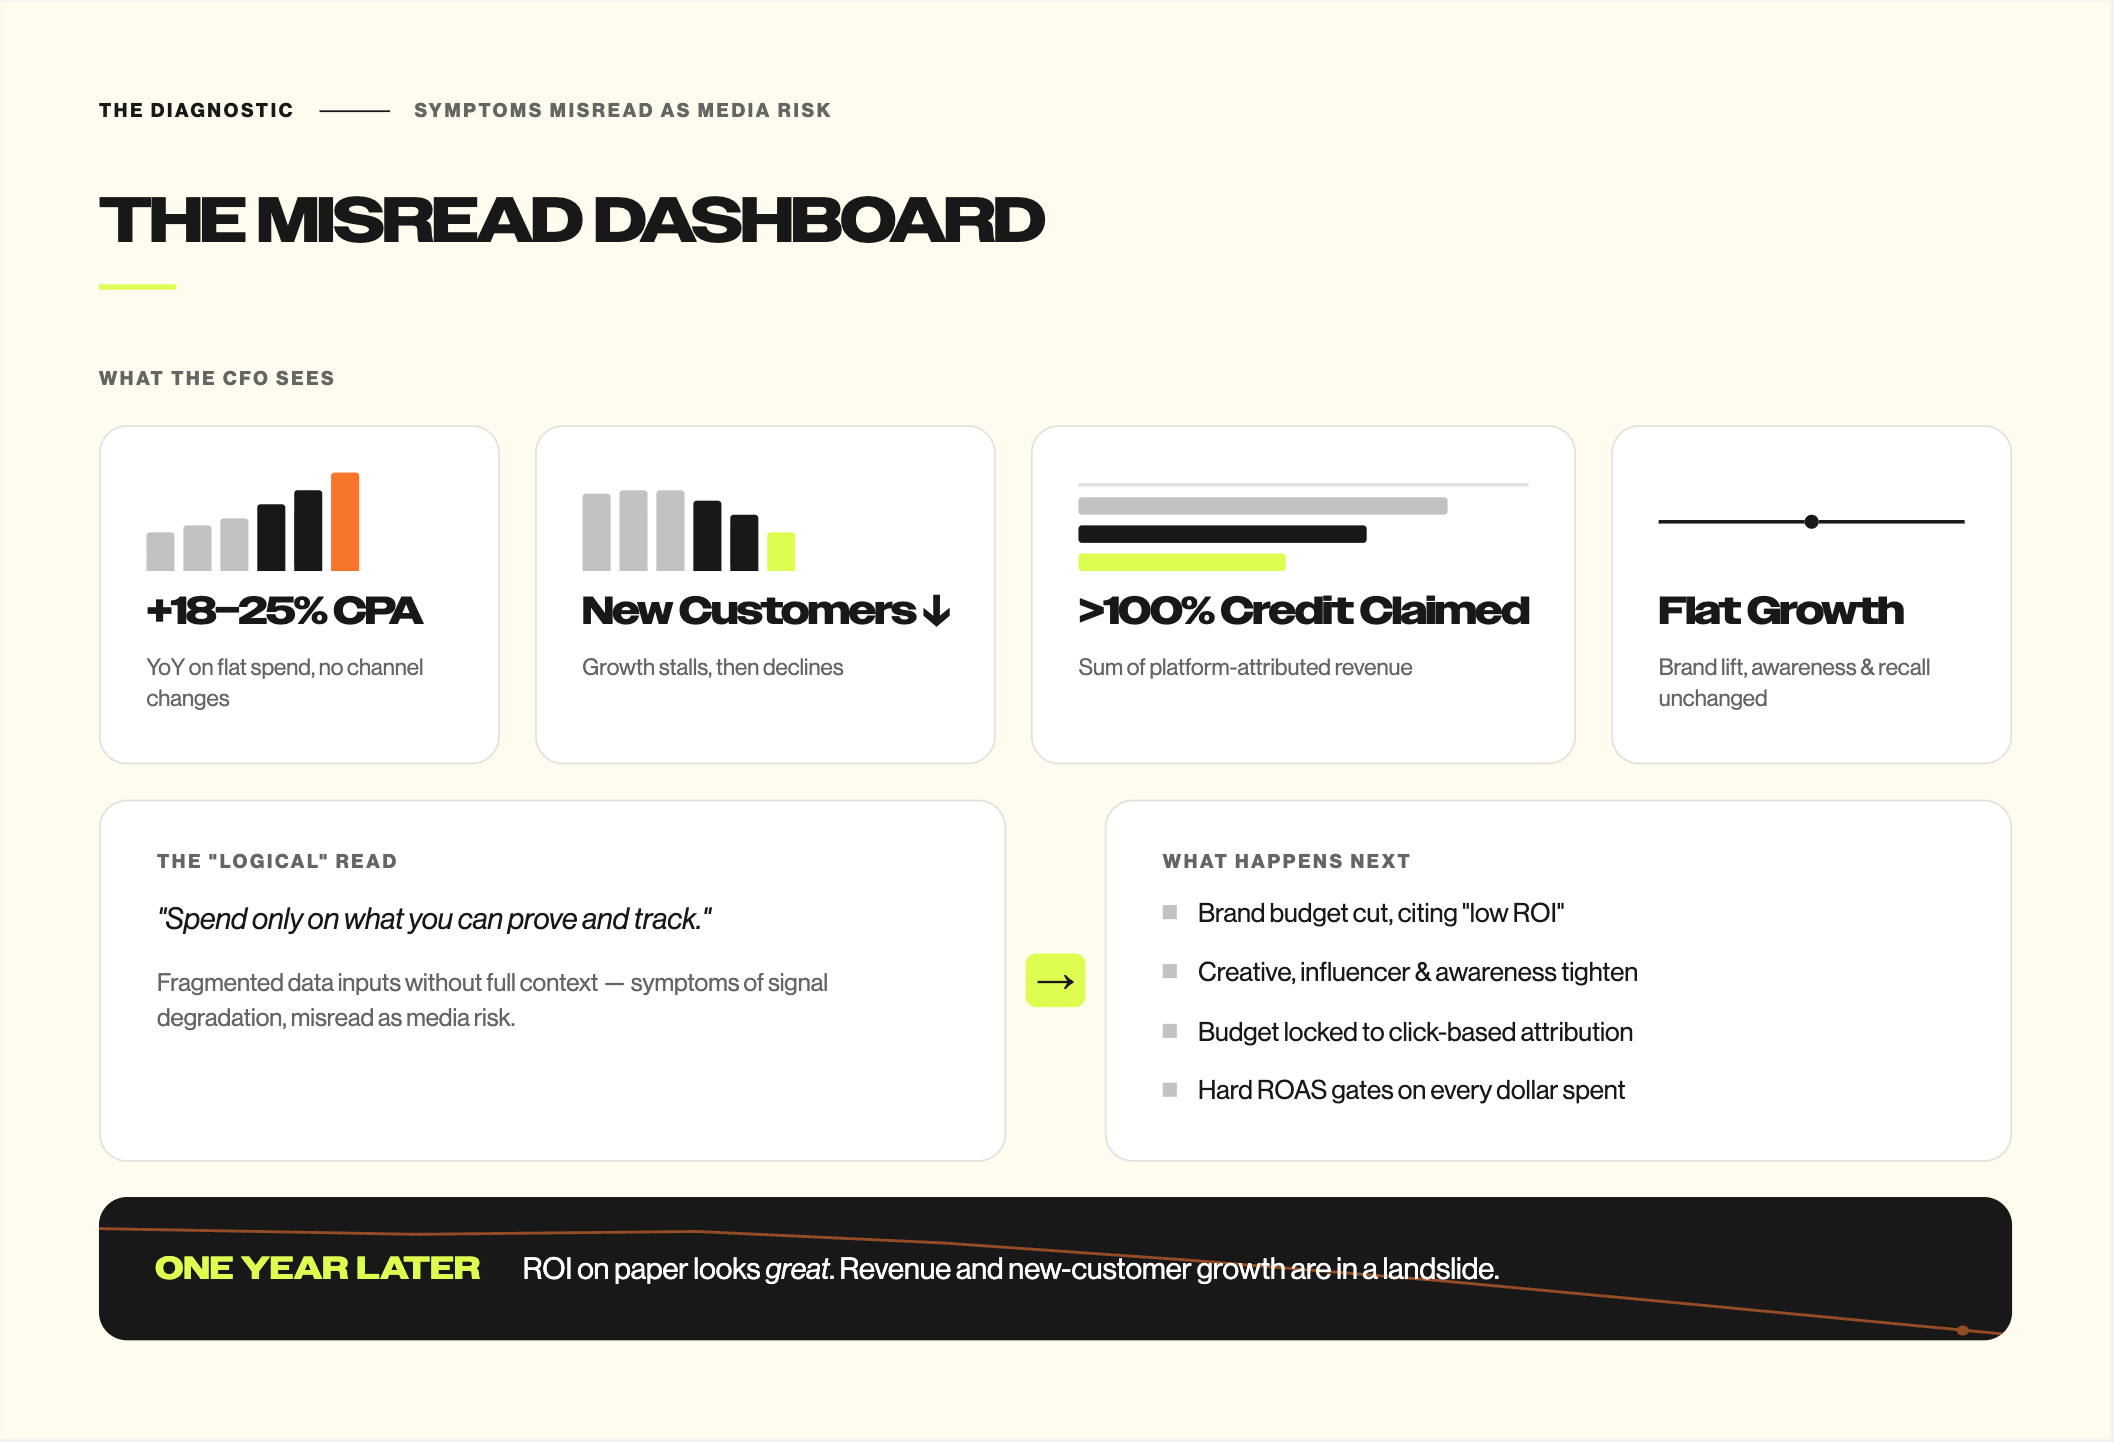
Imagine that a CFO is faced with the following picture:
- CPA has risen 18–25% YoY despite flat media spend and no major changes to media channels/product/etc
- New customer growth has not only flat-lined, but started a declining trend
- Competitors are posting opposite numbers…
- Performance teams cite "platform volatility" while brand lift studies show flat awareness and recall
- The sum of platform-claimed attributed revenue is well above 100%… no one on the team has a clean answer for this
- Margins are going down, the team says they need more budget to do the same job
- The only thing directly tied to a trackable outcome is UTM-linked inbound traffic
What’s a CFO to do in the post-privacy world to spend budgets most diligently? It seems logical to spend only on what you can prove and track, right?
So, what happens next…
- CFO pushes to cut brand strategy budgets, citing "low ROI"
- Creative, influencer and awareness budgets also tighten
- CFO locks in budget to channels using more trustworthy click-based attribution
- CFO sets ROAS targets that must be met for budget to be spent
- 1 year later, the ROI numbers on paper look great.
- But revenue and new customer growth are now in a full-on landslide
This is the critical inflection point in which major systemic change is sought out, and where Neon Growth is often brought in to unpack what went wrong and how to recover the marketing program.
The Original Problem: Signal Degradation & Media Planning
The initial information the CFO made the decisions from were actually likely symptoms of signal degradation which led to a breakdown of media planning.
As more budgets shift to digital and the ecosystems are flooded with more ads than ever, it is true that channels like Meta are seeing systemic increases in CPMs. But brands that are growing aren’t pulling their budgets back, and many also aren’t seeing significant increases in CPAs despite the CPM trends.
“How???,” asks the CFO.
Underlying data & signal infrastructure, channel diversification and brand-forward creative strategy, backed by decision-grade measurement. AKA, the Growth OS Framework we use at Neon Growth, in which brand operates as a core component. More on that later.
First, let’s look at why digital performance signals are murky for so many brands, and why this leads to favoring last-click attribution.
Marketing Data Infrastructure in 2026
A decade ago, channels like Meta could track an individual not only on Facebook, but around the internet. Observing what they engage with, where they go, what they buy and when. While great for marketers, human people and governments found this a bit too intrusive.
Several major waves of digital privacy regulation later, much of the attribution tracking in 2026 is now up to modeling. This is especially true for view-through channels where people rarely click a link and purchase within the allowed attribution window of ~7 days (on the same device, with tracking enabled etc).
Aside from user-level tracking, the other issue is that people have more touchpoints with brands and ads than ever before. And, each platform wants to claim their role in a conversion.
So, how’s a brand actually supposed to measure marketing and make investment decisions these days?
1. 1st Party Data as the Foundation
Ensuring data is flowing correctly internally and externally to ad channels is a foundational component of media efficiency, especially post-iOS 14.
Internally, a brand needs to be able to identify users and track them through their journey. This means passing through things like UTMs, and making sure the internal CRM is set up to track important user events in a way that signals can flow back to ad channels. It also means unifying data if users interact in multiple places like websites, apps, and stores. Data fidelity becomes especially important for brands with complex or long user journeys. For example, if a conversion often takes longer than a 7 day window, you also need to be tracking upper-funnel events that predict future conversion.
Customer behavior is also important to decision making. Brands need to know their LTV curve to understand how much to spend and what to measure. Does the majority of LTV happen early then taper, or does LTV grow strongly over 12+ months? These are two different strategies.
Let’s take a gym chain model as an example. The goal is to get a person to sign up first, and ultimately convert into a subscribing customer. The majority likely submit a form on your website or on the ad platform. A portion may start their journey with a call or show up in person. The CRM should (1) pass through where the lead came from; (2) track key events like trial starts, visits, and subscriptions; (3) pass back event data to the ad platforms with the identifiers as complete as possible; (4) rank lead quality if conversions aren’t always relatively equal in value (i.e. a 1 week pass vs a personal training client).
2. Optimizing Feedback Loops
Externally, ad channel algorithms rely largely on signals you provide to guide targeting decisions. Set up properly, these signals guide the algorithm to understand who’s a good customer for you and also who’s likely worth bidding more for.
This is why CAPI/server-side tracking are important. If the ad channels only see the platform data (i.e. who clicked or watched), but not the full feedback loop of who is actually completing the action you consider to be a conversion, it’s flying partially blind.
The data layer you build internally feeds the external ad channels and helps train them on who a good customer for you actually is.
Solid customer data is also a requisite for cleanly segmenting customers from engaged prospects and net new audiences. Without this, ad algorithms guided to maximize ROAS will gravitate to the consumers closest to making the conversion vs a balanced approach that favors long-term growth.
3. Platform Attribution vs MER vs MMM
Once your data feedback loop is working cleanly, the signals on the ad platform get clearer individually. But we’re still left with rectifying which touchpoints are actually most impactful in the purchase decision and deserve more budget. The more channels an advertiser uses, the more complex this question becomes.
Streams like retargeting and brand search show high ROAS, but have low incrementality. View-through channels often have low ROAS when tracked with click-based attribution, but may be contributing significantly to consideration.
The simplest way to analyze directional performance of the strategy is Marketing Efficiency Ratio (MER). Essentially, revenue divided by the costs of marketing investment. If your investment goes up, revenue also should increase (the timeline depends on your business of course).
Larger companies spending $5M+ annually typically want something a little more specific though, and that’s where Media Mix Modeling (MMM) often comes into play. These models use historical data and industry data to estimate the impact of each channel, and sometimes even individual campaigns & creatives. An MMM will evaluate what happens over time when you increase or decrease investment in various activities, to help understand what has the most impact vs the least. The longer the data set, the better the accuracy.
While not perfect, these models help media planners directionally understand what channels are likely to produce more incremental growth and which have less impact per dollar.
4. Strategic Calibration Experiments
Once the foundations are in order, it’s time to start fine-tuning the media model with strategic channel experiments and lift tests designed to show business incrementality, not just platform vanity metrics.
Tests need to take into account the market landscape, seasonality & promotional environment. Ideally, one lever is changed at a time to produce reliable data.
The Brand Under-Investment Problem
There’s another co-casualty of the measurement problem: brand. In the quest for marketing efficiency, one of the first areas left on the cutting-room floor is upper-funnel advertising and brand investment. It’s much harder to quantify vs performance channels, and gets labeled as purely a cost center.
This is especially common in orgs where the bottom line is hyper-focused on quarterly shareholder returns.
When fewer resources are invested in marketing, new content, creators, PR, and general cultural engagement, ad content often starts to get stale and the algorithm starts losing meaningful differentiation signals. Ads focused on price, urgency and discounts look like they’re performing better, so marketing teams do more of what’s ‘working’. Some brands eventually end up essentially on a perma-sale, training the consumer to place a lower value on the brand (you might be able to think of some historic examples!).
Ultimately, bottom-of-funnel signals are short-lived. They drive spikes, not sustainable brand growth or loyalty.
And because brand lift studies measure awareness and recall (metrics that lag behind creative degradation by 6–12 months) at first it seems like there’s no change. The system is broken, but the data doesn't reflect it yet.
When the measurement framework is functioning correctly, business lift can be mapped more clearly over time to impactful awareness efforts.
The Four Misreadings That Keep Companies Stuck
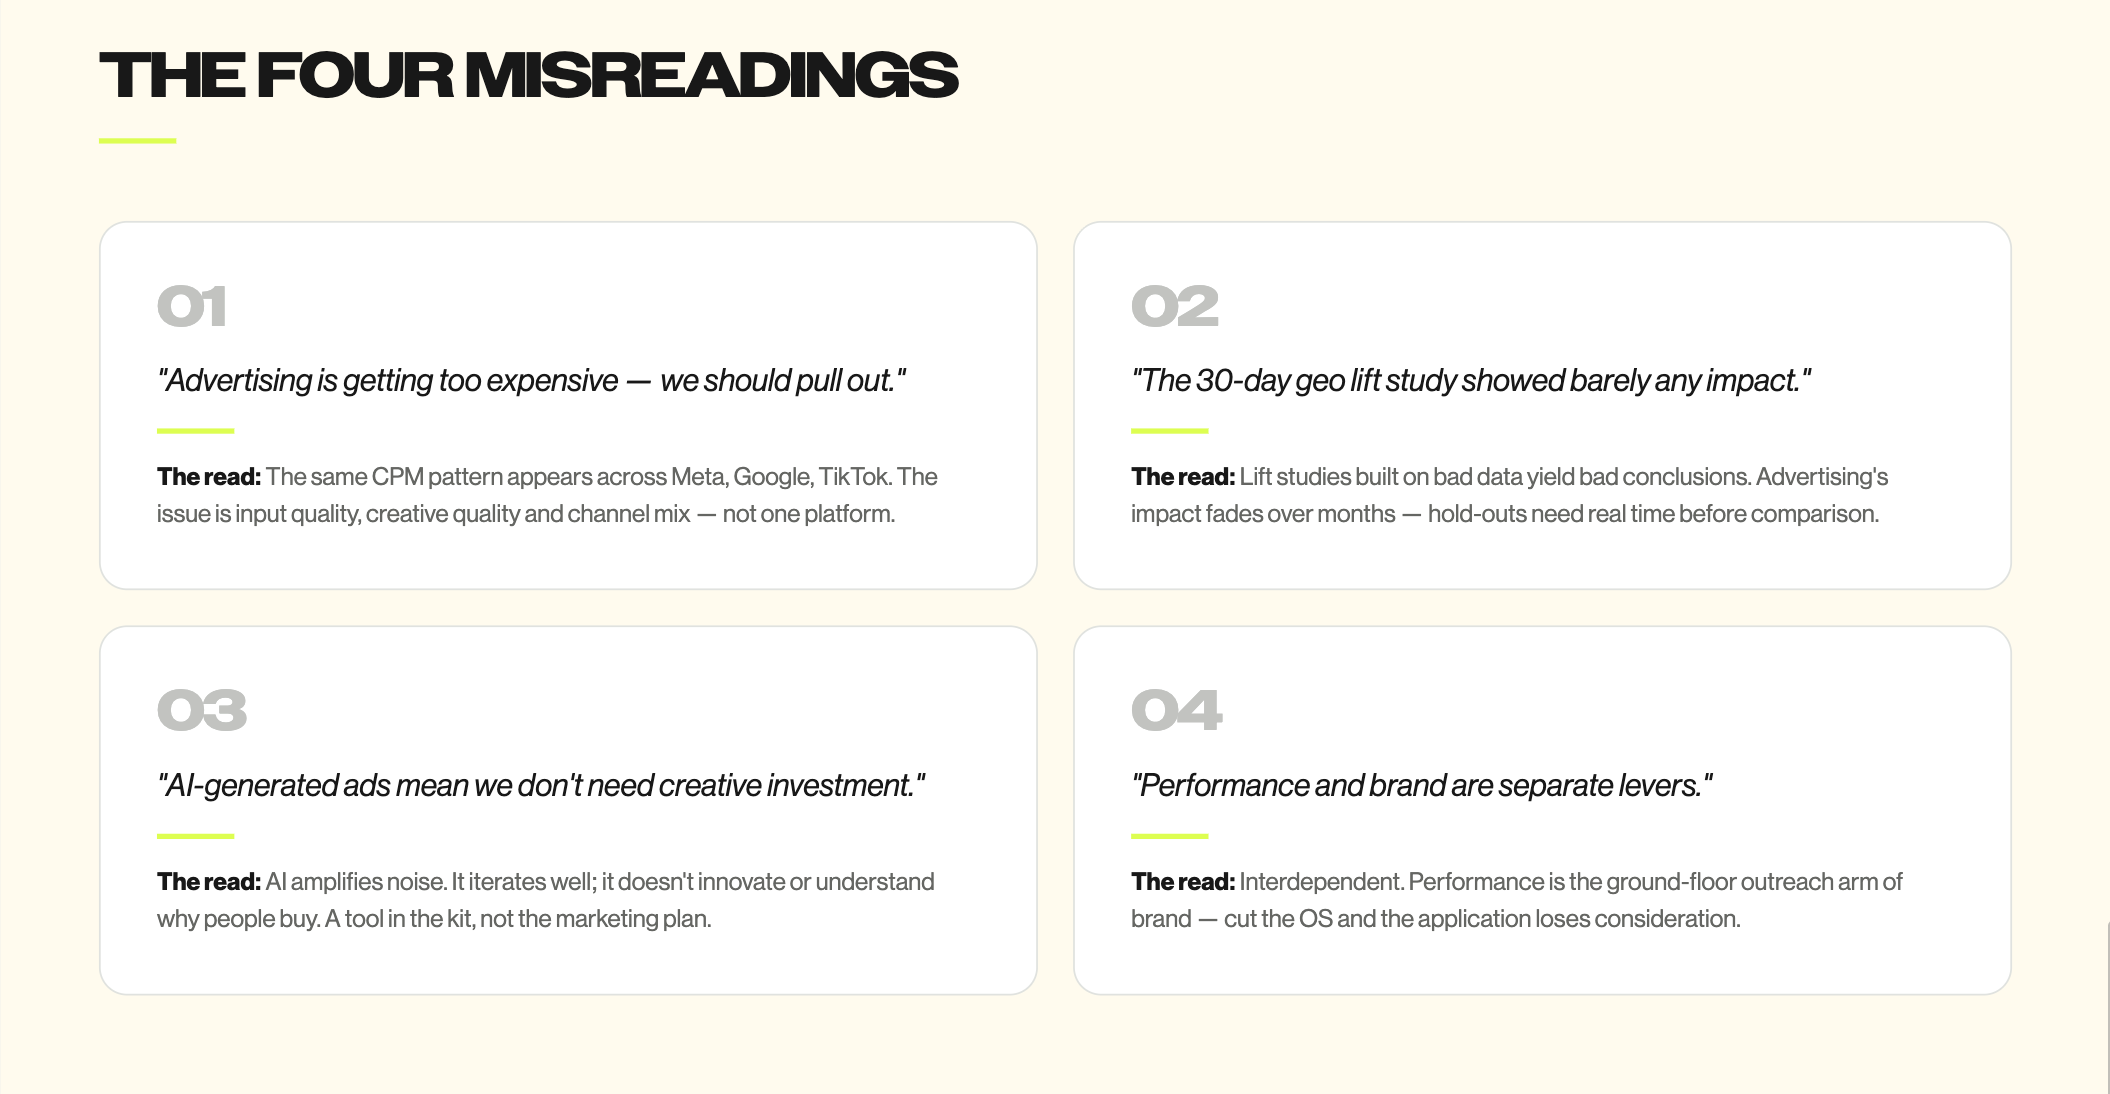
1. Advertising is getting too expensive and we should pull out.
The same CPM pattern appears across Meta, Google, TikTok, and most other ad platforms. The issue is usually input quality, creative quality and channel mix, versus one particular platform.
2. The 30 day geo lift study last year showed barely any impact of marketing.
Lift studies built on bad data yield bad conclusions. And, it’s very hard to create a truly clean study without confounding factors. Synthetic twins alone can be a whole study on anthropology. Not to mention, in many industries, advertising’s impact fades over several months. Meaning, an audience should be held out for a considerable amount of time before being compared in a lift test. Not to mention issues of digital traceability, human movement, and cross-channel contamination.
3. AI generated ads mean we don’t need photoshoots or creative investment anymore.
AI often ends up amplifying noise. The more generic variations brands put ad spend behind, the harder it is for the algorithm to learn what's different. AI has a clear place in strategy, ideation and supporting production, but consumers still expect a level of “real” from brands. And, AI is only as good as the inputs. AI iterates well, it doesn’t innovate quite yet or understand all of the emotional reasons people buy or connect with a brand. It’s a tool in the kit not the whole marketing plan.
4. Performance and brand are separate levers. One doesn’t affect the other.
They're interdependent. When brand is cut, performance teams lose the operating system that drives consumer consideration. If performance operates without respect to the brand’s identity, brand perception is often diluted. Performance marketing is the ground floor outreach arm of brand, where demand is captured and converted.
The Growth OS Framework Fix: Propel Growth, Prove Results
When we start to think of brand and performance as an interconnected system in the Closed Loop Growth framework, tracking the impact of the marketing program becomes clearer.
The shift is toward not just incrementality, but long-term brand health and revenue growth. We measure success through net CPA reduction and incremental conversion behavior.
Less focus on channel-level metrics, more focus on marketing efficiency and strategic media planning, all underpinned by a foundation of data.
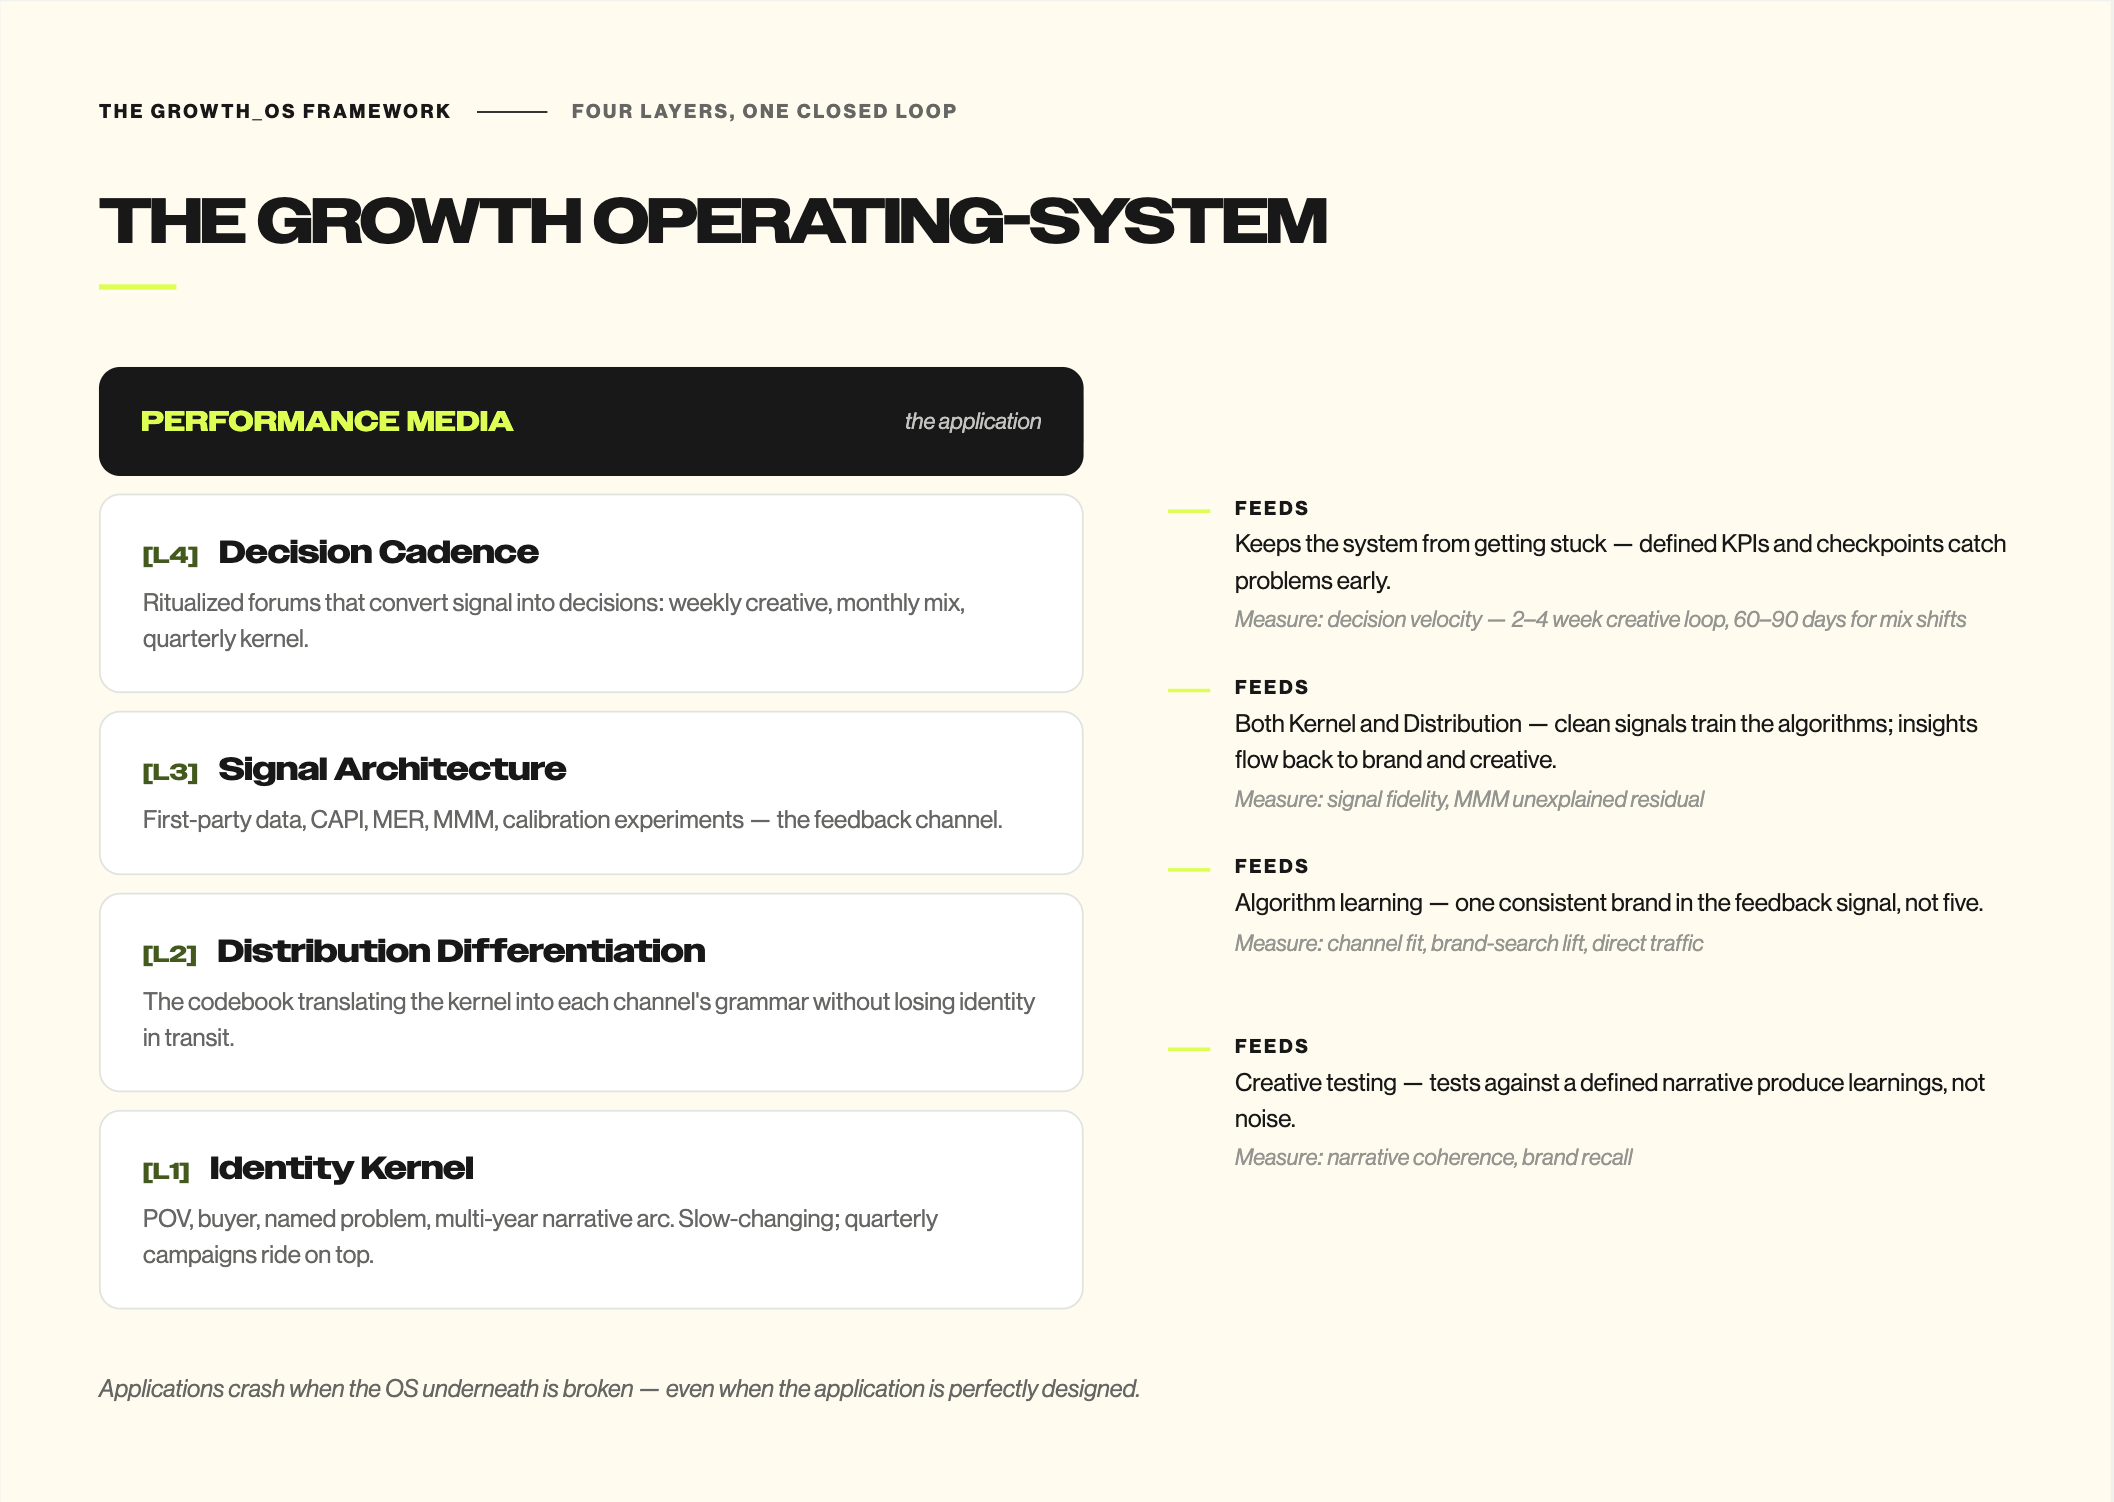
Layer 1: Identity Kernel
The kernel is the load-bearing layer: the point of view, the buyer it serves, the problem it names better than anyone else, the narrative arc that runs across years. It is intentionally slow-changing. Quarterly campaigns ride on top of it.
When the Identity Kernel is clear, performance creative can iterate at speed without losing coherence. Every variation inherits from prior learnings. When it is vague, every creative test becomes a guess about what "the brand" would do, and the algorithm trains itself on inconsistency.
Measurement at this layer is narrative consistency and brand recall. Does the customer's perception of the brand match the kernel that's written down? Most teams measure brand awareness, which is low-ceiling and lagging. What the consumer actually thinks & feels about your brand is far more useful. Few measure narrative coherence, which is high-signal and current.
Layer 2: Distribution Differentiation
Each channel speaks a different native language. Meta rewards motion and short hook structures. Connected TV demands narrative arcs. TikTok lives on microdramas. YouTube lives on long form. X lives on point of view. OOH lives on icon.
The distribution layer is the codebook that translates the kernel into each channel's grammar without losing the identity in transit.
Without it, every shoot starts from scratch. Costs balloon, consistency drops, and the algorithm receives five different "brands" in its feedback signal. Ads optimize toward whatever the lowest common denominator is, usually price or urgency.
Measurement here is channel-fit scoring and channel-level signals. Does the creative on each channel read as the same brand to a customer who sees you in three places? Operational proxies: brand-search lift, direct traffic growth, qualitative "where did you first hear about us" data.
Layer 3: Signal Architecture
This is the layer the first half of this article covered: first-party data, server-side conversion APIs, MER, MMM, calibration experiments. In the Growth OS framing, this layer's job is not measurement for its own sake. It is the feedback channel that lets the kernel and distribution drivers learn. Without it, the rest of the Growth OS runs blind.
Two pathologies show up here. The first: signal is collected but never fed back into creative or budget decisions. It’s measurement built for reporting, not operating. The second: signal is fed back at the wrong cadence. Chasing daily ROAS on a business with a 90-day conversion cycle. Neither serves the system.
Measurement is signal fidelity: what percentage of conversions are matched back to a clean source signal? When’s the optimal time to start a new test and what’s being measured? What's the optimal measurement window for initiatives? How large is the MMM's unexplained residual?
Layer 4: Decision Cadence
The fourth layer is where most CMO/CFO disconnects live. Signal can be perfect; if there is no ritualized forum for converting it into a decision, nothing changes. Decision cadence is the part of the OS that makes everything else work.
In healthy Growth OS implementations: weekly creative reviews tied to in-platform signal, monthly mix reviews tied to MMM updates, quarterly kernel reviews tied to qualitative customer evidence, annual narrative refreshes and product roadmaps. Each cadence has a decision map on when to spend, kill, or pivot at each tier based on KPIs.
Without this layer, the symptom is the one that opened this article. A CFO sees rising CPA, has no forum to interrogate the signal architecture, defaults to the safest cut (brand), and discovers a year later that the system optimized itself into a dead end.
Measurement here is decision velocity: from signal observation to action taken. Best-in-class enterprises run a 2-4 week loop for performance creative, 60-90 days for mix shifts, annually for the kernel.
How the layers connect to performance media
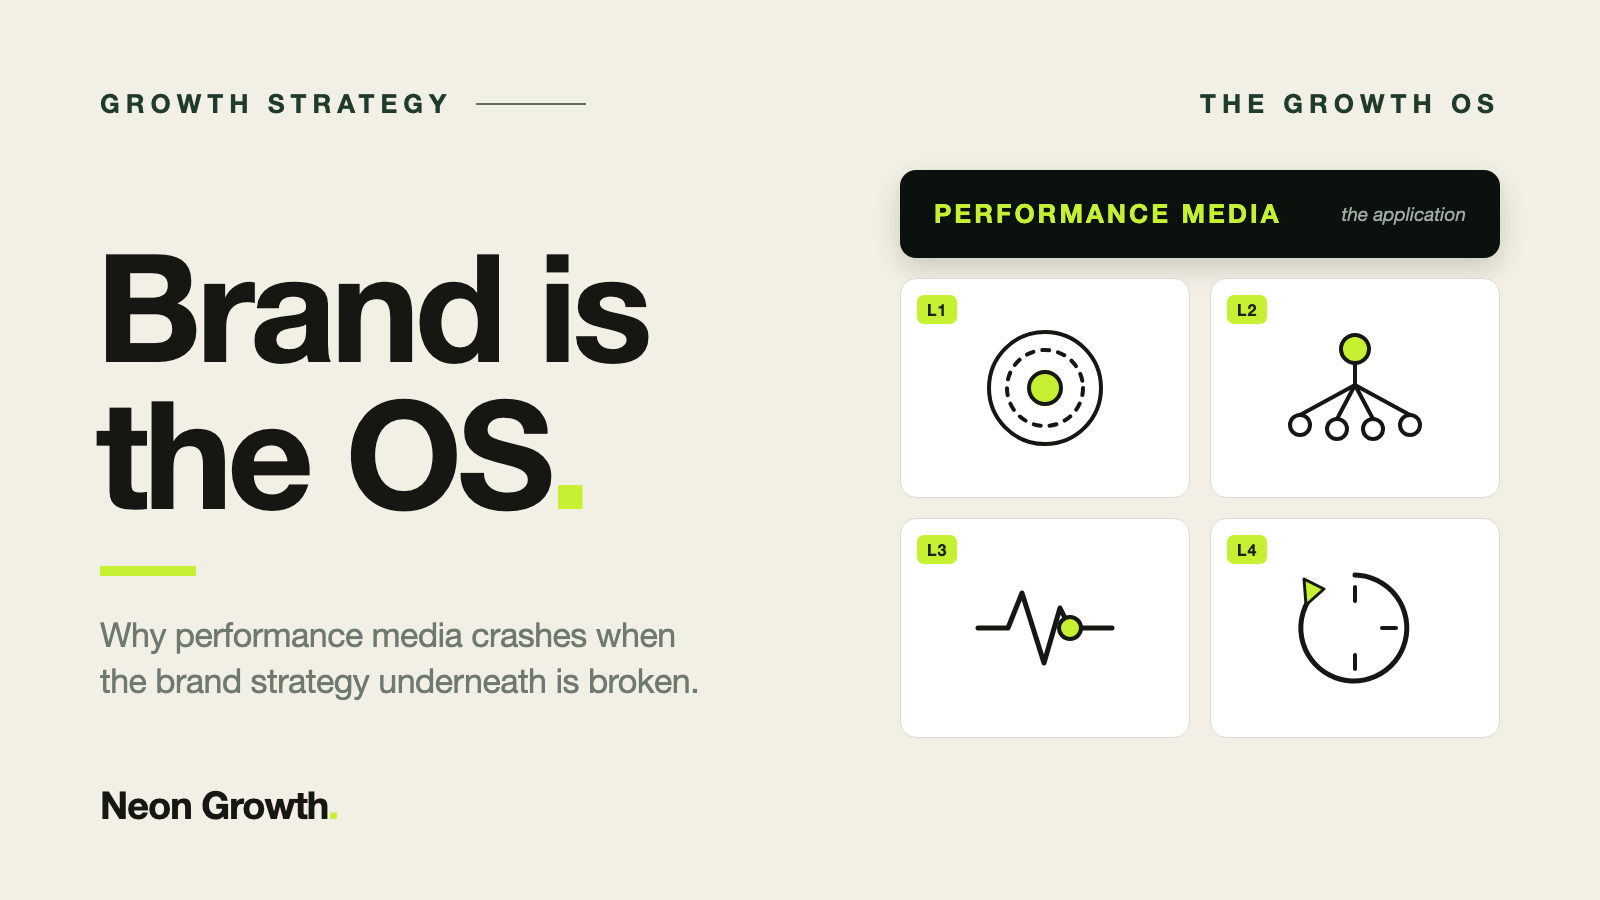
The shorthand: performance media is the application. Brand strategy is the OS. Applications crash when the OS underneath is broken, even when the application is perfectly designed.
What this looks like in practice:
- The Identity Kernel feeds creative testing. Tests against a defined narrative produce learnings. Tests against vague positioning produce noise. Outcomes are tracked, winning segments are scaled, new hypotheses based on consumer signals are formed.
- Distribution Differentiation feeds algorithm learning. Consistent brand expression across channels gives the algorithms signals to learn "good customer" patterns. It also helps the human audience understand & connect your brand, wherever they encounter it. Channel native strategy, optimized for humans, within the larger media plan.
- Signal Architecture feeds both Kernel and Distribution. Clean first-party signals flowing to ad channels help algorithms learn. Performance insights flowing back help brand and creative teams optimize identity & differentiation. Bigger picture measurement keeps the media mix balanced and focused on incremental growth vs vanity metrics.
- Decision Cadence keeps the system from getting stuck. Markets change. Brands pivot. Ad channels evolve, as does creative. Defined KPIs and decision checkpoints across creative, media, brand and measurement layers catch problems early and highlight opportunities faster.
The diagnostic question for any enterprise is the same: name the layer that is broken. Quite often, it is not the one being blamed.
Action Item: Diagnose Your Growth OS
The Growth OS diagnostic below walks each of the four layers and flags the breakages by symptoms. The deliverable is a 4-layer scorecard with the highest-leverage repair sequenced first, so the next dollar of marketing investment lands where it actually compounds.